Join us on the Community Forums!
-
Community Guidelines
The Fitbit Community is a gathering place for real people who wish to exchange ideas, solutions, tips, techniques, and insight about the Fitbit products and services they love. By joining our Community, you agree to uphold these guidelines, so please take a moment to look them over. -
Learn the Basics
Check out our Frequently Asked Questions page for information on Community features, and tips to make the most of your time here. -
Join the Community!
Join an existing conversation, or start a new thread to ask your question. Creating your account is completely free, and takes about a minute.
Not finding your answer on the Community Forums?
- Community
- Health & Wellness
- Sleep Well
- Sleep chart on app
Options
- Mark Topic as New
- Mark Topic as Read
- Float this Topic for Current User
- Bookmark
- Subscribe
- Mute
- Printer Friendly Page
Turn on suggestions
Auto-suggest helps you quickly narrow down your search results by suggesting possible matches as you type.
- Community
- Health & Wellness
- Sleep Well
- Sleep chart on app
Sleep chart on app
ANSWEREDOptions
- Mark Topic as New
- Mark Topic as Read
- Float this Topic for Current User
- Bookmark
- Subscribe
- Mute
- Printer Friendly Page

Recovery Runner
15
0
15
 Best Answer
1 BEST ANSWER
Accepted Solutions

Cosmic Hurdler
21636
2704
12872
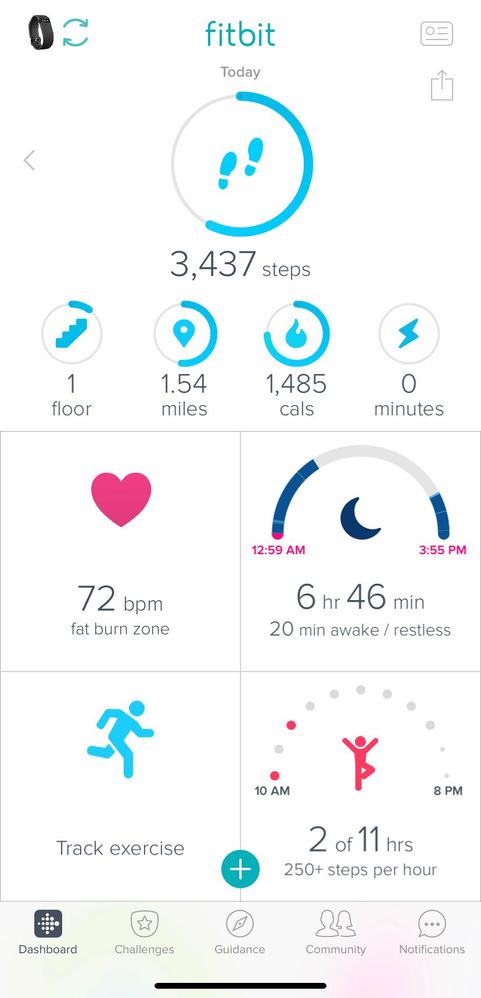
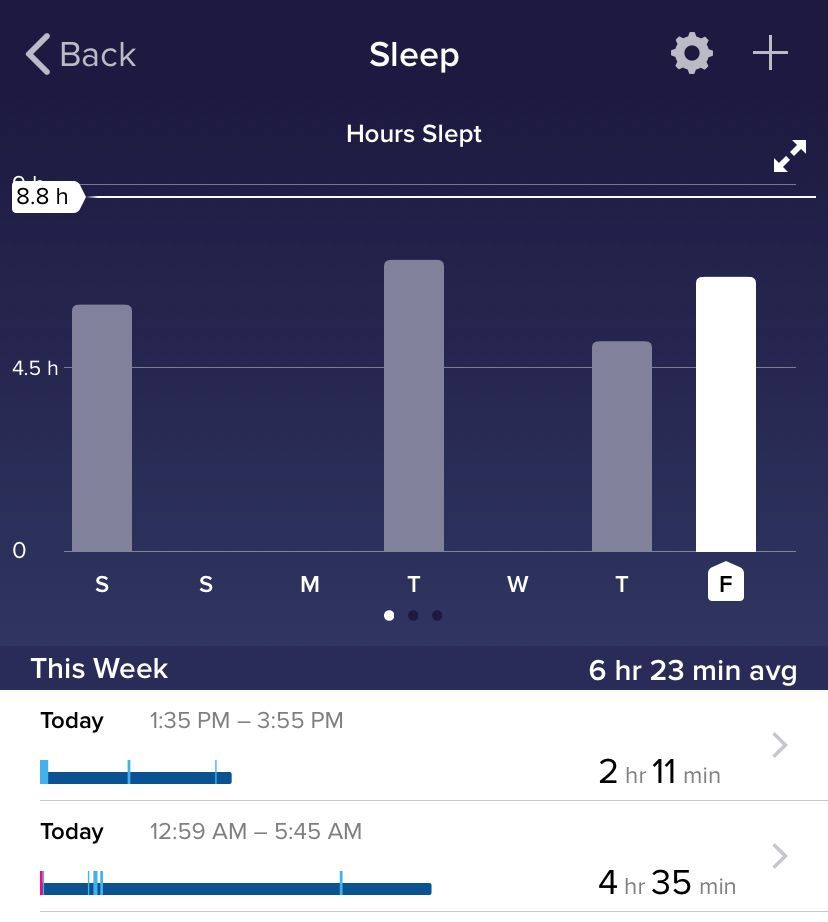
If you are talking about on the semicircle graph to the right of heart rate, the gray area is when you were awake, apparently from 5:45 AM until 1:35 PM. It is showing two sleeps periods and the awake time in between.
Before posting, re-read to see if it would make sense to someone else not looking at your Fitbit or phone.
2 REPLIES 2
Cosmic Hurdler
21636
2704
12872
If you are talking about on the semicircle graph to the right of heart rate, the gray area is when you were awake, apparently from 5:45 AM until 1:35 PM. It is showing two sleeps periods and the awake time in between.
Before posting, re-read to see if it would make sense to someone else not looking at your Fitbit or phone.