Join us on the Community Forums!
-
Community Guidelines
The Fitbit Community is a gathering place for real people who wish to exchange ideas, solutions, tips, techniques, and insight about the Fitbit products and services they love. By joining our Community, you agree to uphold these guidelines, so please take a moment to look them over. -
Learn the Basics
Check out our Frequently Asked Questions page for information on Community features, and tips to make the most of your time here. -
Join the Community!
Join an existing conversation, or start a new thread to ask your question. Creating your account is completely free, and takes about a minute.
Not finding your answer on the Community Forums?
- Community
- Platform
- Android App
- Re: Estimated Oxygen Variation graph is broken
- Mark Topic as New
- Mark Topic as Read
- Float this Topic for Current User
- Bookmark
- Subscribe
- Mute
- Printer Friendly Page
- Community
- Platform
- Android App
- Re: Estimated Oxygen Variation graph is broken
Estimated Oxygen Variation graph is broken
ANSWERED- Mark Topic as New
- Mark Topic as Read
- Float this Topic for Current User
- Bookmark
- Subscribe
- Mute
- Printer Friendly Page
07-21-2022
10:45
- last edited on
07-22-2022
15:00
by
LizzyFitbit


07-21-2022
10:45
- last edited on
07-22-2022
15:00
by
LizzyFitbit
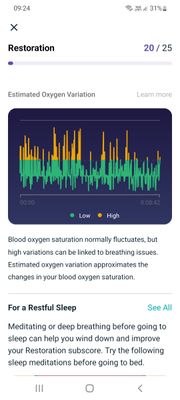
Hi, I just noticed that the green and yellow lines have changed and now are all over the place on the graph. All graphs for different days start with a 0:00 hrs. The fluctuations are not at all in line with what I was reading up until today. Anyone experienced this issue?? Thanks
Moderator Edit: Clarified subject
Answered! Go to the Best Answer.
Kudos. Good to hear about a device that delivers. How do you like it?
My EOV charts do not match between the old and the new version in side by side comparison.
 Best Answer
08-12-2022
15:36
- last edited on
08-03-2024
08:14
by
MarreFitbit


 Community Moderators ensure that conversations are friendly, factual, and on-topic. We're here to answer questions, escalate bugs, and make sure your voice is heard by the larger Fitbit team. Learn more
08-12-2022
15:36
- last edited on
08-03-2024
08:14
by
MarreFitbit
Hi everyone.
Thanks for taking the time to share your feedback, as well as the steps tried on your own. I'm happy to share with you that our team has released the Android app 3.65 version (Android 8.0 OS or higher) which includes improvements for the Estimated Oxygen Levels graph. Because this is a progressive roll out, if you don't see it available yet, check later.
Your feedback and patience are truly appreciated. Please don't hesitate to let me know if the issue persists so I can keep our team informed.

So why can't release notes just say that instead of the standard "We fixed some bugs and made stability improvements."?

I'm not seeing an update in the play store.

Yes same issue. Guess there is nothing we can really do about I have read thousands of comments but here we are.
You just got an update???
Best Answer
on the 10th and it worked - even though Play store said my Fitbit had been updated on the 9th - on the 9th everything looked the same with lots of yellow lines etc. but when I updated on the 10th everything was back to normal - hope that makes sense
Best Answer
I keep checking the app but has not gave me the choice showing an update
The smoothing/averaging function has been sensitized to the point of uselessness. We're just presented with a useless instantaneous variation graph.
Doesn't anyone at Fitbit test stuff before updating millions of customers?
More than useless now. But I can't even show you a before and after, because the new algorithm is retroactive...
Well I'm updated but you didn't redraw the graphs that you converted with the last update. I'm guessing the problem wasn't just the graphs but the underlying data. So I'll guess I'll have to wait and see tomorrow if you've actually fixed it.
Did you get the new 3.65 update yet
Best Answer
Same question here, I just wanna know if someone on 3.65 had its graphs back to "normal" it's fine if fitbit updates stuff and let's say now we realize we have to go to the doctor, but just tell us.
I have no issue getting a polisomnography, but I won't go spend that money if it's just a bug.
Thanks,

Exactly! My graphs are still "off" ... Waiting Fitbit.... Ugh
08-12-2022
19:46
- last edited on
08-17-2022
10:48
by
RodrigoMFitbit
08-12-2022
19:46
- last edited on
08-17-2022
10:48
by
RodrigoMFitbit
I called customer support she said they are rolling it out in small waves its on its way....but I agree if someone out there already has the 3.65 can you please let us know if your information reverted back to what those past graphs showed or not?
You got 3.65 update already?
Best Answer

SunsetRunner
Nope it's still messed up. Getting really fed up now. You really need to be doing something about this. App is fully updated and we are still seeing these crazy graphs. It's ridiculous.